Module 3: Analysis of Financial Statements
(Accounting for Managers – ACCT602, Semester I)
⚠️ Portal verification note: Module 3 is locked in the AMIGO course until Module 2 is marked complete, so this module's content is PDF-based only and has not yet been cross-checked against the live course (unlike Module 1, which is fully SCORM-verified). Ask me to continue the SCORM walkthrough if you want full portal verification here too.
3.1 Comparative Statement Analysis
Financial Statement Analysis = Analysis (simplifying data) + Interpretation (explaining significance). Used to assess profitability, efficiency, financial health.
Horizontal Analysis (Trend Analysis)
- Compares data across 2+ years; one year = base year (100%).
- Formulas:
- Absolute Change = Current Period Value − Previous Period Value
- % Change = (Absolute Change ÷ Previous Period Value) × 100
- Good for spotting trend direction (uptrend/downtrend/sideways) across years.
- Limitation: choice of base year can distort the picture; segment restructuring can break comparability.
Vertical Analysis (Common-Size Statements)
- Each line item expressed as % of a base item within the same period:
- Balance Sheet → base = Total Assets
- Income Statement → base = Net Sales
- Useful to compare companies of different sizes (standardises the statements).
flowchart LR
    A[Financial Statement Analysis] --> B["Horizontal / Trend Analysis (across years, base year = 100%)"]
    A --> C["Vertical / Common-Size Analysis (within one year, base = Total Assets or Net Sales)"]
    A --> D["Ratio Analysis (relationships between line items)"]
🧠 Memory trick — Horizontal vs Vertical: Horizontal = History (compares across years/history); Vertical = Vs-each-other-within-one-year (compares line items as a % of one base, standing "vertically" down a single column).
Horizontal vs Vertical — Exam favourite
| Basis | Horizontal | Vertical |
|---|---|---|
| Comparison | Across multiple periods | Within a single period |
| Base | Base year = 100% | Base item (Total Assets/Sales) = 100% |
| Other name | Trend Analysis | Common-Size Analysis |
| Best for | Growth trend over time | Comparing companies of different sizes |
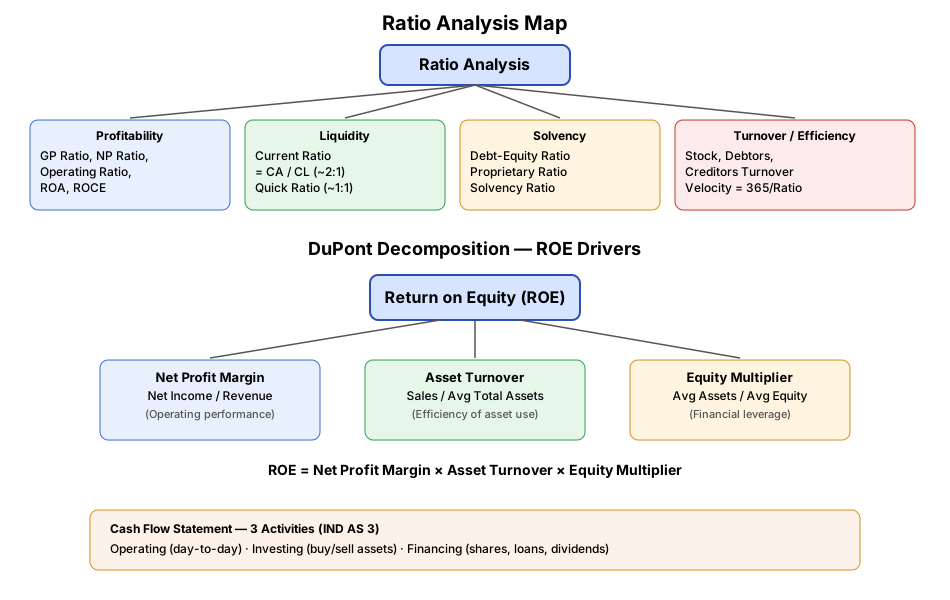
3.2 Ratio Analysis — the most exam-critical section
🧠 Memory trick for the 5 ratio categories — "Please Learn Some Tough Exams": Profitability, Liquidity, Solvency, Turnover/Efficiency, Earning.
A. Profitability Ratios
| Ratio | Formula |
|---|---|
| Gross Profit Ratio | Gross Profit ÷ Sales × 100 |
| Net Profit Ratio | Net Profit ÷ Sales × 100 |
| Operating Ratio | (COGS + Operating Expenses) ÷ Net Sales × 100 |
| Return on Assets (ROA) | Net Profit after Tax ÷ Average Total Assets × 100 |
| Return on Capital Employed (ROCE) | Net Profit after Tax ÷ Total Capital Employed × 100 |
B. Liquidity Ratios (short-term solvency)
| Ratio | Formula | Ideal |
|---|---|---|
| Current Ratio | Current Assets ÷ Current Liabilities | ≈ 2:1 |
| Acid-Test / Quick Ratio | (Current Assets − Stock − Prepaid Exp.) ÷ Current Liabilities | ≈ 1:1 |
C. Solvency Ratios (long-term)
| Ratio | Formula |
|---|---|
| Debt-Equity Ratio (long-term) | Long-term Debt ÷ Net Worth (Shareholders' Funds) |
| Total Debt-Equity Ratio | (Short-term + Long-term Debt) ÷ Equity |
| Proprietary Ratio | Net Worth ÷ Total Assets |
| Solvency Ratio | Total Assets ÷ Total Liabilities |
D. Turnover / Efficiency Ratios
| Ratio | Formula |
|---|---|
| Stock Turnover Ratio | COGS ÷ Average Stock |
| Debtors Turnover Ratio | Net Credit Sales ÷ (Debtors + Bills Receivable) |
| Debtors Velocity (collection period) | 365 ÷ Debtors Turnover Ratio |
| Creditors Turnover Ratio | Credit Purchases ÷ Average Creditors |
| Creditors Velocity (payment period) | 365 ÷ Creditors Turnover Ratio |
E. Earning Ratios
- EPS = (Net Profit − Preference Dividend) ÷ No. of Equity Shares
- DPS = Dividend paid to equity shareholders ÷ No. of Equity Shares
F. DuPont Decomposition — very high-yield topic
ROE = Net Profit Margin × Asset Turnover × Equity Multiplier - Net Profit Margin = Net Income ÷ Revenue - Asset Turnover = Sales ÷ Average Total Assets - Equity Multiplier = Average Total Assets ÷ Average Shareholders' Equity
flowchart LR
    ROE["Return on Equity (ROE)"] --> NPM["Net Profit Margin\n(Net Income / Revenue)"]
    ROE --> AT["Asset Turnover\n(Sales / Avg Total Assets)"]
    ROE --> EM["Equity Multiplier\n(Avg Assets / Avg Equity)"]
Why it matters: shows whether ROE is driven by profitability, efficiency, or leverage — a classic case-study/discussion question.
🧠 Memory trick — DuPont's 3 levers, "PEA": Profit margin, Efficiency (asset turnover), Amplification (equity multiplier/leverage) — ROE = P × E × A.
3.3 Cash Flow Statement (as per IND AS 3)
Shows sources and uses of cash — explains the change in cash balance between two balance sheet dates.
Three Activities
flowchart TD
    CFS[Cash Flow Statement] --> OA["Operating Activities\n(day-to-day business: cash from customers, payments to suppliers/employees)"]
    CFS --> IA["Investing Activities\n(purchase/sale of fixed assets, investments)"]
    CFS --> FA["Financing Activities\n(issue of shares/debentures, loan repayment, dividend paid)"]
Direct vs Indirect Method (for Operating Activities only)
| Method | Approach |
|---|---|
| Direct | Lists actual cash receipts and payments (cash from customers − cash to suppliers/employees, etc.) |
| Indirect | Starts from Net Profit, then adjusts for non-cash items (add back depreciation) and changes in working capital (± change in current assets/liabilities) — most commonly used & tested |
Indirect Method — Quick Structure:
Net Profit before Tax
+ Depreciation & non-cash expenses
± Changes in Working Capital (increase in CA = subtract, increase in CL = add)
= Cash from Operating Activities
Long-Answer Questions (15 Marks — model answers, ~300 words each)
Q1. Differentiate between Horizontal and Vertical Analysis, and explain their significance in financial statement analysis. Horizontal and Vertical Analysis are the two basic techniques used to simplify and interpret financial statements before deeper ratio analysis is applied. Horizontal Analysis, also called Trend Analysis, compares the same line item across two or more accounting periods — one period is chosen as the base year (set at 100%), and every subsequent year's figure is expressed both as an absolute change (Current Value − Previous Value) and a percentage change [(Absolute Change ÷ Previous Value) × 100] relative to that base. This lets an analyst spot whether sales, expenses, or profits are trending up, down, or sideways over time, and by how much — for instance, seeing that Net Sales grew 12% while COGS grew 20% immediately signals margin pressure worth investigating. Its main limitation is that the chosen base year itself must be "normal" — if the base year was unusually good or bad (e.g., a one-off asset sale, or a pandemic-hit year), every subsequent percentage comparison gets distorted. Vertical Analysis, also called Common-Size Analysis, instead expresses every line item as a percentage of one base item within the same period — for the Balance Sheet, the base is Total Assets; for the Income Statement, the base is Net Sales. This converts absolute rupee figures into comparable proportions, making it possible to compare a small company against a much larger one on a like-for-like basis (e.g., "COGS is 60% of sales" is comparable across companies of any size, whereas "COGS is ₹6 crore" is not). The key distinction, then, is that Horizontal Analysis looks across time to reveal trend and growth patterns, while Vertical Analysis looks within one period to reveal structural composition and enables cross-company comparison. In practice, analysts use both together — vertical analysis to understand a company's current cost/asset structure, and horizontal analysis to see how that structure and scale are evolving year over year — giving a fuller diagnostic picture than either technique alone.
Q2. Explain the key ratios used to assess a company's liquidity and solvency, with their formulas and significance. Liquidity ratios measure a company's ability to meet its short-term obligations, while solvency ratios measure its ability to meet long-term obligations and its overall capital structure risk — together they answer "can this company pay what it owes, both soon and eventually?" The Current Ratio (Current Assets ÷ Current Liabilities) is the broadest liquidity measure, with an ideal benchmark of roughly 2:1, meaning the company holds twice as many short-term resources as short-term obligations; a ratio well below 1 signals possible difficulty paying bills on time, while an excessively high ratio can indicate idle, poorly-utilised current assets. The Quick/Acid-Test Ratio [(Current Assets − Inventory − Prepaid Expenses) ÷ Current Liabilities], ideally around 1:1, is a stricter test because it excludes inventory (which may be slow-moving or hard to liquidate quickly) and prepaid expenses (which can't be converted to cash at all) — it answers "can the company pay creditors without relying on selling stock?" On the solvency side, the Debt-Equity Ratio (Total/Long-term Debt ÷ Shareholders' Equity) measures financial leverage — how much of the business is financed by outside borrowing versus owners' funds; a high ratio means higher fixed interest obligations and higher financial risk, especially if profits dip. The Proprietary Ratio (Net Worth ÷ Total Assets) shows what proportion of total assets is funded by owners rather than creditors — a higher ratio indicates a more conservatively financed, lower-risk balance sheet. The Interest Coverage Ratio (EBIT ÷ Interest Expense) shows how comfortably operating profits cover interest obligations — a ratio below 1.5–2 is often a red flag for lenders. Together, liquidity ratios protect against near-term cash crunches, while solvency ratios protect against long-term over-leverage; a company can look solvent on paper (low debt) yet still fail from a liquidity crunch, which is why both sets of ratios must be read together, not in isolation.
Q3. Explain DuPont Analysis. How does it decompose Return on Equity (ROE), and why is this decomposition useful? DuPont Analysis is a technique that breaks down Return on Equity — the single most-watched profitability metric for shareholders — into three distinct drivers, revealing why a company's ROE is high or low rather than just reporting the final number. The formula is ROE = Net Profit Margin × Asset Turnover × Equity Multiplier. The Net Profit Margin (Net Income ÷ Revenue) captures profitability — how much profit the company keeps from every rupee of sales, driven by pricing power, cost control, and operating efficiency. The Asset Turnover Ratio (Sales ÷ Average Total Assets) captures efficiency — how effectively the company uses its asset base to generate revenue, driven by inventory management, capacity utilisation, and receivables collection. The Equity Multiplier (Average Total Assets ÷ Average Shareholders' Equity) captures financial leverage — how much of the asset base is funded by debt rather than equity; a higher multiplier means more leverage, which amplifies ROE but also amplifies risk. The power of this decomposition is diagnostic: two companies can report an identical 15% ROE for completely different reasons — one might achieve it through high margins and modest leverage (a quality, low-risk business), while another achieves the same ROE only by taking on heavy debt to multiply a thin margin (a risky, leverage-driven business). An investor or manager relying on ROE alone would treat both companies as equally attractive, but DuPont analysis exposes the difference, making it invaluable for comparing companies within an industry, diagnosing a declining ROE trend (has margin fallen, has efficiency dropped, or has the company simply deleveraged?), and setting management performance targets that don't inadvertently reward excessive risk-taking through leverage alone. This is precisely why DuPont analysis is a favourite case-study and discussion topic in management accounting.
Q4. What is a Cash Flow Statement? Explain its three main activities with examples, and distinguish between the Direct and Indirect methods. A Cash Flow Statement (prepared under Ind AS 7 / AS 3) explains the change in a company's cash and cash-equivalent balance between two Balance Sheet dates by classifying all cash movements into three activities. Operating Activities cover the cash effects of the company's core, day-to-day revenue-generating operations — cash received from customers, cash paid to suppliers and employees, and cash paid for operating expenses and taxes; this is the most important section because it shows whether the core business itself is cash-generative. Investing Activities cover cash flows related to the acquisition and disposal of long-term assets and investments — for example, purchase of plant and machinery, proceeds from sale of a fixed asset, or purchase/sale of long-term investments; a growing company typically shows negative investing cash flow (spending on growth), which is not necessarily a bad sign. Financing Activities cover cash flows between the company and its owners/lenders — proceeds from issuing shares or debentures, repayment of loans, and dividends paid; this section reveals how the company is funding itself and rewarding capital providers. Operating cash flow specifically can be computed by either the Direct Method, which lists actual gross cash receipts and payments (cash from customers minus cash to suppliers, employees, etc.) giving a very transparent but data-intensive picture, or the far more commonly used Indirect Method, which starts from Net Profit before Tax and works backward: add back non-cash expenses like depreciation (since they reduced profit but didn't use cash), then adjust for changes in working capital — an increase in current assets (like debtors or stock) is subtracted (cash is tied up), while an increase in current liabilities (like creditors) is added back (cash is preserved) — arriving at Cash from Operating Activities. The Indirect Method is preferred in practice and in exams because it directly reconciles profit with cash, highlighting the gap between "accounting profit" and "actual cash generated," which is often the crux of a case-study question on why a profitable company still faces a cash crunch.