- Module 2: Preparation of Financial Statements
- 2.1 Financial Statements — Meaning & Users
- 2.2 Income Statement (P&L Account)
- Revenue (from Lesson 5)
- Cost of Goods Sold (from Lesson 6)
- Operating Expenses (from Lesson 7)
- Profit After Tax (from Lesson 8)
- Full Worked Example — GHI Market Associates Corporation (real multi-step Income Statement from the course)
- Structure (Top → Bottom, "waterfall")
- Key Formulas (write these exactly in exams)
- 2.3 Balance Sheet
- 2.4 Depreciation
- Module Summary (from Lesson 22, straight from the course's own recap screen)
- Glossary (from Lesson 23)
- Self-Study Exercise Prompts (from Lesson 25, "attempt in your notebook")
- Learning Activities (from Lesson 26, group/self-practice prompts)
- Long-Answer Questions (15 Marks — model answers, ~300 words each)
Module 2: Preparation of Financial Statements
(Accounting for Managers – ACCT602, Semester I)
Verified against the live AMIGO course (SCORM outline, Lesson 1 "Learning Objectives" of 27 lessons — read directly from the portal, not just the PDF). The course's own topic sequence is: 2.1 Financial Statements → 2.2 Income Statement → 2.3 Balance Sheet → 2.4 Depreciation, matching the structure below.
Official Learning Objectives (from the course itself): - Analyse financial statements essentials - Identify key elements of financial statements - Evaluate the income statement: revenue and cost of goods sold - Evaluate the income statement: operating expenses and Profit After Tax (PAT) - Assess Dividends and Earnings Per Share (EPS) - Examine the balance sheet: liabilities - Analyse the balance sheet: assets - Evaluate the balance sheet: working capital - Examine equity changes - Introduce the concept of depreciation
(Update: Module 2 is now FULLY complete — all 27/27 lessons done live in the LMS (every accordion/quiz/flashcard/marker interacted with), the 2nd Module Assessment scored 100% (30/30), AND every section below (2.1 through 2.4) has been rewritten/verified against the actual video-lecture and reading-page content of Lessons 1-21 — not just the PDF. Look for the ✅ "Verified against the live course" callouts throughout for the lecture-sourced material, including real worked examples like the GHI Corporation income statement, the ACC Limited balance sheet, and the XYZ Corporation working capital calculation.)
2.1 Financial Statements — Meaning & Users
Financial statements = Balance Sheet + P&L (Income) Statement + Cash Flow Statement + Notes/Schedules.
✅ Verified against the live course (Lessons 3-4, completed in-LMS): Financial analysis is defined as identifying the financial strengths and weaknesses of a business by establishing relationships between elements of the balance sheet and income statement — used to assess liquidity, solvency, profitability, and operational efficiency, and to forecast short- and long-term prospects. Financial statements are described as "the outputs of financial accounting and the final products of the accounting process."
Characteristics (nature) — the course presents these as 4 tabs, each with a concrete example:
| Characteristic | What it means (with the course's own example) |
|---|---|
| Recorded Facts | Based only on data drawn from accounting records — only facts already recorded in the books are included. |
| Accounting Principles | Prepared following certain principles/concepts/conventions — e.g. inventory valued at "cost or market price, whichever is lower." |
| Assumptions | Based on assumptions like stable money value and Going Concern (the business will continue operating in the foreseeable future). |
| Personal Judgment | Choices like stock valuation or depreciation method depend on the accountant's discretion among acceptable alternatives. |
Essential qualities: Understandability, Relevance, Reliability & Accuracy, Comparability, Completeness, Timeliness. (Good 5-mark question: "Explain the essential qualities of financial statements")
🧠 Memory trick for Users of Financial Statements — "My Investor Trusts Banks, Even Given Customer Promises": Management, Investors, Trade Creditors, Banks, Employees, Government, Customers, Public.
Users of Financial Statements (exam favourite — list with 1-line purpose each; the course itself lists 7 core groups — Management, Investors, Trade Creditors/Suppliers, Banks, Customers, Employees, Government — with Public/Trade Unions as an 8th add-on):
| User | Why they need it |
|---|---|
| Management/Owners | Ascertain earning capacity, financial position, and growth — to make decisions and manage the business more efficiently |
| Investors (shareholders/debenture holders) | Buy/hold/sell decisions, solvency check |
| Trade Creditors/Suppliers | Will they be paid on time? |
| Banks | Loan repayment capacity |
| Employees | Job security, bonus, wage negotiation |
| Government | Tax, policy, regulation (e.g. SEBI) |
| Customers | Continuity of supply |
| Public/Trade Unions | Social responsibility, wage bargaining |
2.2 Income Statement (P&L Account)
Shows performance over a period (flow statement). Net Income = Revenue − Expenses.
✅ Verified against the live course (Lessons 5-8, completed in-LMS): the Income Statement's amounts are recorded for a specific period only — "the next period's income statement will begin with all amounts reset to zero" (this is why nominal accounts are closed off each year rather than carried forward — see Module 1's OPCC/nominal-account rule).
Revenue (from Lesson 5)
Revenue = total value of goods/services sold in a period; it's the starting point of the income statement and commonly called the "Top Line" (alongside "Sales"/"Income"). Formula depends on business type: - Product companies: Revenue = No. of Units Sold × Average Selling Price - Service companies: Revenue = No. of Customers × Average Price of Services
Revenue Recognition Principle: revenue is recognised when ownership benefits/risks transfer from seller to buyer, or when services are fully delivered — not necessarily when payment is actually received. If a credit sale is made, the sale is still recorded as revenue immediately (and shown as Accounts Receivable on the Balance Sheet); when cash is later collected, no additional income is recorded — only Cash increases and Accounts Receivable decreases.
Cost of Goods Sold (from Lesson 6)
For a simple trading concern, COGS is built up as:
| Particulars | ₹ |
|---|---|
| Opening Stock | XXX |
| Add: Purchases | XXX |
| Add: Freight | XXX |
| Goods available for sale | XXX |
| Less: Closing Stock | (XXX) |
| Cost of Goods Sold | XXX |
Worked Example — T-Account P&L vs Single-Step Income Statement (same figures, two formats): Sales ₹89,740; Other Income ₹39,947; COGS ₹78,680; Expenses ₹33,804; Director's Fee ₹11; Depreciation ₹2,094; Interest ₹2,902; Provision for Taxation ₹6,565. - Traditional "T-shape" P&L A/c (Dr. side = all expenses + Net Profit balancing figure; Cr. side = Sales + Other Income): both sides total ₹1,29,687, and the balancing Net Profit = ₹5,625. - Single-Step Income Statement (all revenues added, then all expenses subtracted in one block): Net Sales 89,740 + Other Income 39,947 = Total Revenue 1,29,687; less COGS 78,680 + Expenses 33,804 + Director's Fee 11 + Depreciation 2,094 + Interest 2,902 + Provision for Taxation 6,565 = Total Expenses 1,24,062 → Net Profit = ₹5,625 (identical result, different layout).
Operating Expenses (from Lesson 7)
Expenses incurred to run the business that aren't directly tied to production/trading — collectively "operating expenses." Usually split into Administration Expenses (incl. personnel/establishment costs), Finance Expenses, Depreciation, and Selling & Distribution Expenses.
Worked Example — P&L with Operating Expenses: Gross Profit ₹2,00,000; Office Salaries ₹40,000; Postage & Telegrams ₹20,000; Office Rent ₹7,000; Sundry Office Expenses ₹10,000; Selling Expenses ₹8,000; Advertisement ₹12,000; Commission Paid ₹9,000; Commission Received ₹8,000 (income); Prepaid Rent ₹1,000; Outstanding Salaries ₹15,000. Total Dr. side (expenses) = 40,000+20,000+7,000+10,000+8,000+12,000+9,000 = 1,06,000; Total Cr. side = Gross Profit 2,00,000 + Commission Received 8,000 = 2,08,000 → Net Profit = ₹1,02,000 (transferred to Capital A/c).
Profit After Tax (from Lesson 8)
PAT = the net profit available to shareholders after all costs and taxes — applicable to any business unit (government-owned, privately-owned, or limited liability). India's corporate tax rate is roughly 30% on PBT. Formula: PAT = PBT − Tax; Tax = Tax Rate % × PBT.
Worked Example: ABC Private Limited has Sales $500, Operating Expenses $150, Non-Operating Expenses $68, Tax Rate 30%. Find PAT. - PBT = 500 − (150 + 68) = $282 - Tax = 30% of 282 = $84.6 - PAT = 282 − 84.6 = $197.4
Full Worked Example — GHI Market Associates Corporation (real multi-step Income Statement from the course)
Income Statement for the Year Ended December 31, 2015:
| Particulars | ₹ | ₹ |
|---|---|---|
| Sales | 9,60,000 | |
| Less: Cost of Sales | (6,80,000) | |
| Gross Profit | 2,80,000 | |
| Less: Operating Expenses | ||
| Selling Expenses (Sales Salaries 40,000 + Advertising 15,000 + Store Utilities 6,000 + Store Depreciation 5,000 + Store Supplies 4,000) | 70,000 | |
| Administrative Expenses (Office Salaries 22,500 + Office Utilities 6,500 + Office Depreciation 5,000 + Permits & Licences 4,000 + Office Supplies 2,500 + Bad Debts 1,500) | 42,000 | (1,12,000) |
| Operating Income | 1,68,000 | |
| Add: Other Revenue — Gain on Sale of Equipment | 20,000 | |
| Less: Other Expense — Interest Expense | (12,000) | 8,000 |
| Income before Tax | 1,76,000 | |
| Less: Income Tax Expense | (68,640) | |
| Net Income | 1,07,360 |
This example demonstrates how merchandising/manufacturing income statements distinguish "Cost of Sales" (= COGS) from Selling Expenses (marketing/selling function) and Administrative Expenses (billing, collection, board meetings, etc.) — net income is calculated by deducting all of these from total revenue, and is then used to determine the company's tax liability.
Structure (Top → Bottom, "waterfall")
flowchart TD
    A[Revenue / Net Sales] --> B["Less: Cost of Goods Sold (COGS)"]
    B --> C[Gross Profit]
    C --> D["Less: Operating Expenses (Admin + Selling + Depreciation)"]
    D --> E["Operating Profit (EBIT)"]
    E --> F["Less: Interest / Finance Cost"]
    F --> G["Profit Before Tax (PBT)"]
    G --> H["Less: Tax"]
    H --> I["Profit After Tax (PAT) = Net Profit"]
Key Formulas (write these exactly in exams)
- COGS = Opening Stock + Purchases + Direct Expenses − Closing Stock
- Gross Profit = Net Sales − COGS
- PBT = Total Revenue − Total Expenses (operating + non-operating, excl. tax)
- PAT = PBT − Tax
- Dividend per Share (DPS) = Dividend paid to equity shareholders ÷ No. of equity shares
- Earnings per Share (EPS) = (Net Profit − Preference Dividend) ÷ No. of Equity Shares
- No. of equity shares = Total Equity Capital ÷ Face Value per Share
Two presentation formats: Single-step (all revenue − all expenses in one go) vs Multiple-step (Gross Profit → Operating Profit → PBT → PAT, shown stepwise).
Worked Example — Multi-Step Income Statement: From the following figures, prepare a Multi-Step Income Statement for XYZ Ltd for the year ended 31 March: Net Sales ₹8,00,000; Opening Stock ₹1,00,000; Purchases ₹5,00,000; Closing Stock ₹1,20,000; Direct Wages ₹20,000; Administrative Expenses ₹60,000; Selling Expenses ₹40,000; Depreciation ₹15,000; Interest on Loan ₹25,000; Tax Rate 30%.
| Particulars | ₹ | ₹ |
|---|---|---|
| Net Sales | 8,00,000 | |
| Less: COGS (1,00,000 + 5,00,000 + 20,000 − 1,20,000) | (5,00,000) | |
| Gross Profit | 3,00,000 | |
| Less: Operating Expenses | ||
| Administrative Expenses | 60,000 | |
| Selling Expenses | 40,000 | |
| Depreciation | 15,000 | (1,15,000) |
| Operating Profit (EBIT) | 1,85,000 | |
| Less: Interest | (25,000) | |
| Profit Before Tax (PBT) | 1,60,000 | |
| Less: Tax @ 30% | (48,000) | |
| Profit After Tax (PAT) | 1,12,000 |
Exam shortcut: work top-to-bottom exactly along the waterfall mnemonic ("Some Cows Graze On Every Interesting Pasture, Truly Peacefully") — each line only needs ONE subtraction from the line above it, so a numerical error early on is easy to isolate by checking which stage's subtotal looks wrong.
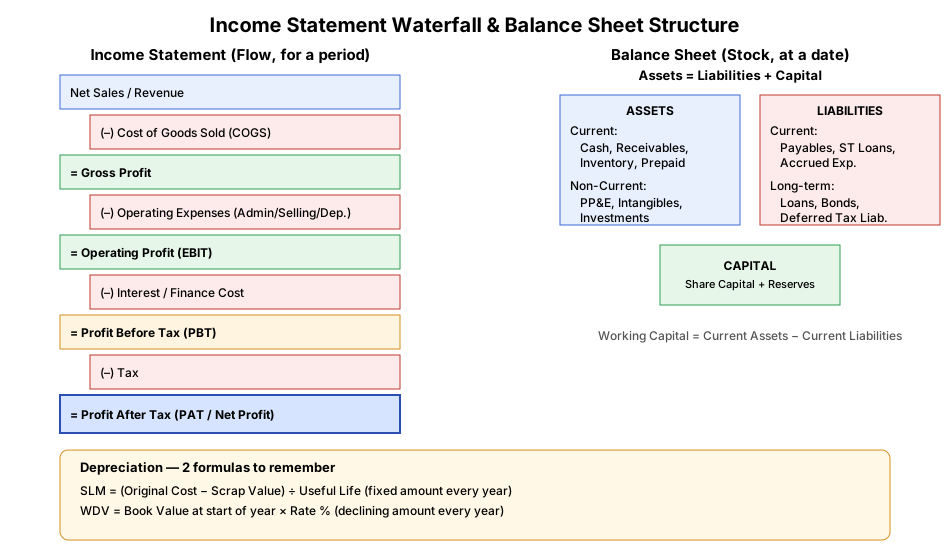
🧠 Memory trick — Income Statement waterfall: "Some Cows Graze On Every Interesting Pasture, Truly Peacefully" → Sales → COGS → Gross Profit → Operating Expenses → EBIT → Interest → PBT → Tax → PAT.
2.3 Balance Sheet
Shows financial position at a point in time (stock/snapshot). Assets = Liabilities + Capital
Liabilities
✅ Verified against the live course (Lesson 11, completed in-LMS): "Liabilities represent the financial obligations or debts that a company owes to external parties" — arising from borrowing money, purchasing goods/services on credit, or accruing unpaid expenses. The Current vs Long-term split is based on one year from the balance sheet date OR the company's operating cycle, whichever is longer (the "operating cycle" exception matters for e.g. construction companies whose cycle exceeds a year).
| Current (due ≤ 1 yr or operating cycle) | Long-Term (due after 1 yr or operating cycle) |
|---|---|
| Accounts Payable — owed to suppliers for goods/services bought on credit | Long-Term Loans — repayment period longer than one year |
| Short-Term Loans — due for repayment within the next year | Bonds Payable — long-term debt securities issued to raise capital |
| Accrued Expenses — incurred but not yet paid (salaries, utilities, taxes) | Deferred Tax Liabilities — taxes due in future periods from temporary differences between accounting and tax rules |
| Income Taxes Payable — taxes owed to the government | |
| Unearned Revenue — payment received in advance for goods/services not yet delivered |
🧠 Key insight from the course: "While liabilities represent obligations, they are not inherently negative — they are a normal part of doing business and often necessary for financing growth and operations. Strategic borrowing and leveraging can enable a company to invest in new projects, expand operations, and increase its competitive advantage." The flip side: excessive liabilities relative to assets/income signal financial distress — liabilities affect Liquidity (ability to meet short-term obligations — high current liabilities vs current assets is a red flag) and Solvency (ability to meet long-term obligations — excessive long-term liabilities vs assets risks financial distress or bankruptcy).
Assets
✅ Verified against the live course (Lessons 12-13, completed in-LMS): Long-term (non-current) assets are recorded on the balance sheet at their historical/acquisition cost, not present/market value — unlike current assets, they cannot easily be sold, consumed, utilised, or depleted within a year through normal operations. An asset's classification as "long-term" depends on whether its useful life exceeds a year — there's no single fixed accounting rule for this, it's a judgment call per asset type.
| Current | Non-Current (Long-term) |
|---|---|
| Cash & Cash Equivalents — readily available funds for day-to-day operations; Marketable Securities — short-term investments quickly convertible to cash; Accounts Receivable — amounts due from customers for credit sales; Inventory — goods for sale, raw materials, WIP; Prepaid Expenses — advance payments for future goods/services | Property, Plant & Equipment (PP&E) — tangible assets used in operations, useful life > 1 year (land, buildings, machinery); Intangible Assets — non-physical (patents, trademarks, copyrights, goodwill); Long-term Investments — stocks/bonds/securities not intended for sale within a year; Deferred Tax Assets — arise from temporary differences between book value and tax base, resulting in future tax deductions |
Investments (Lesson 13) — sums of money invested outside the business (stocks, property, firms, subsidiary companies). Required to be classified into 7 categories on the Balance Sheet: Equity Instruments, Preference Shares, Government/Trust Securities, Debentures/Bonds, Mutual Funds, Partnership Firms, and Other Investments (specify nature).
✅ IFRS 9 classification of investments (as taught in the course) — 3 measurement categories: 1. Amortised Cost — for debt/bonds held to collect contractual cash flows (held to maturity) 2. Fair Value through P&L (FVTPL) — for derivatives/shares held for trading; fluctuations adjusted directly through Profit & Loss 3. Fair Value through OCI (FVOCI) — for shares held for investment purposes; fluctuations reported through Other Comprehensive Income instead of P&L
Real Balance Sheet reference — ACC Limited, as at 31 March 2024 (Schedule III format, ₹ in crore): Total Non-Current Assets 13,390.88 (PP&E 8,609.07 + Right of use assets 445.08 + Capital WIP 972.03 + Intangibles 173.15 + Investments in subsidiaries/associates/JVs 596.98 + other items) + Total Current Assets 9,486.97 + Assets held for sale 21.85 = Total Assets ₹22,899.70 crore, exactly balancing Total Equity (16,021.95) + Total Liabilities (6,877.75) = ₹22,899.70 crore — a genuine large-company example of the Assets = Liabilities + Equity identity holding at scale.
Key Ratios from the Balance Sheet (frequently asked numericals)
| Ratio | Formula | Tells you |
|---|---|---|
| Current Ratio | Current Assets ÷ Current Liabilities | Short-term liquidity (ideal ≈ 2:1) |
| Quick/Acid-Test Ratio | (Current Assets − Inventory) ÷ Current Liabilities | Stricter liquidity |
| Debt-Equity Ratio | Total Liabilities ÷ Shareholders' Equity | Financial leverage/risk |
| Interest Coverage Ratio | EBIT ÷ Interest Expense | Ability to pay interest |
| Asset Turnover Ratio | Net Sales ÷ Average Total Assets | Efficiency of asset use |
Working Capital Management: Working Capital = Current Assets − Current Liabilities. Positive WC = short-term solvency.
✅ Verified against the live course (Lesson 14, completed in-LMS): Working capital is "a critical measure of a company's operational efficiency and short-term financial health." Note also: while positive working capital is generally the safety benchmark, "certain businesses may function well with negative working capital" — this applies to companies with rapid cash flow that don't depend on working capital to pay invoices/obligations (e.g. supermarket chains that collect cash from customers immediately but pay suppliers on 30-60 day terms).
4 reasons Working Capital matters (from the course): 1. Meet Short-Term Obligations — pay bills, salaries, and short-term expenses on time, avoiding operational disruptions. 2. Maintain Smooth Operations — purchase raw materials, produce goods, manage inventory effectively, sustaining the production cycle. 3. Invest in Growth Opportunities — positive WC gives flexibility to expand capacity, launch products, or enter new markets. 4. Enhance Creditworthiness — companies with strong working capital are viewed more favourably by creditors and investors.
5 Strategies for Managing Working Capital: Inventory Management, Accounts Receivable Management, Accounts Payable Management, Cash Management, Short-term Financing.
3-Step method to compute Working Capital (as taught): (1) Determine present/current assets from the balance sheet's asset section; (2) Compute current liabilities from the balance sheet's liabilities section; (3) Apply the formula — a positive result confirms the business has sufficient assets to cover its current liabilities.
Worked Example — Computing Working Capital (XYZ Corporation): Current Assets: Cash ₹50,000 + Accounts Receivable ₹80,000 + Inventory ₹1,20,000 = Total Current Assets ₹2,50,000. Current Liabilities: Accounts Payable ₹60,000 + Short-Term Debt ₹30,000 = Total Current Liabilities ₹90,000. Working Capital = 2,50,000 − 90,000 = ₹1,60,000 (positive — the company has ample short-term resources to cover its near-term obligations).
Worked Example — Ratios from a Balance Sheet: A company reports: Current Assets ₹6,00,000 (of which Inventory ₹2,00,000), Current Liabilities ₹3,00,000, Total Liabilities ₹9,00,000, Shareholders' Equity ₹6,00,000, EBIT ₹2,40,000, Interest Expense ₹60,000. - Current Ratio = 6,00,000 ÷ 3,00,000 = 2:1 (healthy, at the textbook-ideal benchmark) - Quick Ratio = (6,00,000 − 2,00,000) ÷ 3,00,000 = 4,00,000 ÷ 3,00,000 = 1.33:1 (still comfortably above the 1:1 benchmark even excluding inventory) - Debt-Equity Ratio = 9,00,000 ÷ 6,00,000 = 1.5:1 (for every ₹1 of owners' funds, ₹1.50 is borrowed — moderately leveraged) - Working Capital = 6,00,000 − 3,00,000 = ₹3,00,000 (positive — short-term solvent) - Interest Coverage Ratio = 2,40,000 ÷ 60,000 = 4 times (EBIT covers interest 4× over — comfortable safety margin; below ~1.5× is a red flag for lenders)
Exam shortcut for ratio questions: always write the formula first, then plug in numbers — examiners give partial marks for the correct formula even if the arithmetic is off, and it's the fastest way to catch which figure you're missing.
Statement of Changes in Equity (SOCE) — expanded from Lesson 21, completed in-LMS: reconciles opening and closing balance of each equity component (share capital, reserves, retained earnings) — shows effect of profit, dividends, new share issues.
✅ Verified against the live course: Governed by Ind AS 1 (mirrors IAS 1). Under the Companies Act 2013, "Financial Statement" is defined in Section 2(40) and explicitly includes the SOCE — this was a new formal recognition versus the old Companies Act 1956 regime (which only required a share-reconciliation note, via Revised Schedule VI / an ICAI Guidance Note, not a full SOCE).
Mandatory vs optional by framework: for Ind AS-compliant companies, presenting the SOCE is mandatory (Ind AS 1). For companies still on the older AS (non-Ind AS) framework, Schedule III does not prescribe a format for it, so it is not mandatory — a genuine live ambiguity, since (as of this writing) no MCA notification has clarified which companies must present it either way.
4 required elements of the SOCE (Ind AS 1 minimum): 1. Total comprehensive income for the period — split between owners of the parent and non-controlling interests (only relevant for consolidated statements; a single entity attributes it all to its own owners). 2. Effects of retrospective application/restatement (per Ind AS 8) — prior-period error corrections or retrospective accounting-policy changes, shown separately from current-period movements. 3. Reconciliation of opening and closing balances for each equity component — broken down by Profit or Loss, Other Comprehensive Income, and transactions with owners (share issues, dividends) — best shown as a table with equity components as columns and transactions as rows. 4. Dividends and related disclosures — dividends recognised as distributions to owners, plus dividend-per-share, shown on the face of the SOCE or in notes (IFRS 18 update).
NOT part of the SOCE (exam trap): Provision for doubtful debts — this is a Balance Sheet/P&L item (an asset valuation adjustment), not an equity movement, so it never appears in the SOCE.
Sample SOCE layout (columns = equity components, rows = period events):
| Particulars | Share Capital | Share Premium | Retained Earnings | Revaluation Reserve | Total Equity |
|---|---|---|---|---|---|
| Balance as at 1 Apr | 500,000 | 100,000 | 300,000 | 50,000 | 950,000 |
| Profit for the year | 120,000 | 120,000 | |||
| Other comprehensive income | 10,000 | 10,000 | |||
| Issue of share capital (at premium) | 100,000 | 50,000 | 150,000 | ||
| Dividends paid | (40,000) | (40,000) | |||
| Balance as at 31 Mar | 600,000 | 150,000 | 380,000 | 60,000 | 1,190,000 |
2.4 Depreciation
Systematic allocation of the cost of a tangible fixed asset over its useful life (AS-6). Excludes land, goodwill.
✅ Verified against the live AMIGO course (Lessons 16-17, completed in-LMS) — exact AS-6 definition: "Depreciation is a measure of wearing out, consumption or other loss of value of a depreciable asset, arising from use, [passage] of time or obsolescence through technology and market changes. Depreciation is allocated so as to change a fair proportion of the depreciable amount in each accounting period during the expected useful life of the asset." Depreciable assets exclude: land, goodwill, forests, livestock, and R&D costs.
Merits and Demerits of the Straight-Line Method (from the course's interactive exercise): | 👍 Merits | 👎 Demerits | |---|---| | Simple to calculate and understand | Ignores the actual pattern of asset usage (heavier use in early years isn't reflected) | | Depreciation charge is uniform, so easy to budget | Doesn't account for interest/opportunity cost of capital tied up in the asset | | Asset is fully written down to scrap value by end of useful life | Repair costs rise in later years while depreciation stays flat, distorting total-cost trend | | | Not ideal for assets that lose value quickly at first (e.g. vehicles, tech) |
Methods (numerical-heavy — practice these)
| Method | Formula | Feature |
|---|---|---|
| Straight Line (SLM) | (Original Cost − Scrap Value) ÷ Useful Life | Fixed depreciation every year; simple |
| Written Down Value (WDV) | (Book Value at start of year) × Rate % | Declining amount every year; matches tax rules in India |
| Annuity Method | Uses annuity tables; includes notional interest on capital sunk | For leases; keeps interest + depreciation constant |
| Sinking Fund Method | Sets aside equal annual amount + invests it to accumulate replacement cost | Used when asset must be replaced at end of life |
| Depletion Method | Cost ÷ Estimated total units (of mine/quarry) × Units extracted | For wasting/natural resources |
flowchart LR
    A[Depreciation Methods] --> B[Straight Line - Fixed amount]
    A --> C[WDV - Declining amount]
    A --> D[Annuity - includes interest]
    A --> E[Sinking Fund - accumulates replacement fund]
    A --> F[Depletion - per unit extracted, for mines]
🧠 Memory trick — "Silly Wolves Always Sing Deeply": Straight Line → WDV → Annuity → Sinking Fund → Depletion.
Change in Depreciation Rate or Useful Life (from Lesson 20, completed in-LMS)
When the depreciation rate changes (e.g. tax law amendment, IFRS/AS/Ind AS update) or the useful life estimate is revised, the change is applied prospectively only — no journal entry is needed to fix past years, and past depreciation is never restated retrospectively. The new charge is simply: (Net Book Value at the point of revision) ÷ (Remaining useful life).
Worked example (SLM revision): ABC Ltd. bought an asset for ₹20,000 three years ago, useful life 10 years, salvage value ₹2,000 (SLM). In year 4, a survey revises the salvage value to nil. - Depreciable Value = 20,000 − 2,000 = 18,000 - Accumulated Depreciation (3 yrs) = 18,000 × 3/10 = ₹5,400 - Net Book Value = 20,000 − 5,400 = ₹14,600 - Remaining useful life = 7 years; since salvage value is now nil, the whole ₹14,600 is depreciable - Revised annual depreciation = 14,600 ÷ 7 = ₹2,086/year (for year 4 onward)
Industry patterns for rate/life changes: Manufacturing (plant/machinery rates vary with tech change; accelerated depreciation when obsolete), IT & Software (hardware depreciates fast due to tech change; software amortised over shorter useful life; rates tied to digital-asset tax rules), Real Estate (buildings have long, stable useful lives; changes mainly from revaluation), Mining (uses depletion method, tied to reserve estimates), Automobile (usage-intensity and resale value driven; EVs may get accelerated depreciation provisions).
🧠 Pros/Cons of revising depreciation rate/life: Pros — reflects actual wear and tear, can reduce taxable income (tax shield), lets businesses adjust to real financial performance, keeps compliance with accounting standards. Cons — complex accounting adjustments, can cause inconsistent financial statements year-to-year, and sudden/frequent changes may attract audit scrutiny.
Full Worked Example: Final Accounts with Adjustments (classic 15-mark question format, from Lesson 20)
This is the standard exam pattern — a trial balance plus a list of adjustments, requiring a Trading & P&L A/c and Balance Sheet.
Problem (Chandrashekar, year ended 31 Mar 2006): Trial balance included Purchases 20,000, Returns Inward 1,500, Opening Stock 8,000, Salaries 4,200, Wages 1,200, Rent 350, Sales 30,500, Sundry Debtors 14,000, Capital 24,000, Sundry Creditors 10,000, Machinery 5,000, Furniture 2,000, Bad debts 400, Insurance 400, plus other minor balances. Adjustments: (a) Closing stock ₹7,000 (b) Insurance prepaid ₹60 (c) Outstanding salaries ₹200, wages ₹200 (d) Provision for doubtful debts 5% on debtors (e) Interest on capital 5% p.a. (f) Depreciate Machinery 5%, Furniture 10% (g) Reserve for discount on creditors 1%.
Solution approach (memorise this sequence for any final-accounts adjustment question): 1. Trading A/c: Opening Stock + Purchases (− Returns Inward) + direct expenses (Wages, incl. outstanding) − Closing Stock → Gross Profit c/d. 2. P&L A/c: Gross Profit b/d + indirect incomes (Discount received, Reserve for discount on creditors) − indirect expenses (Salaries incl. outstanding, Rent, Insurance net of prepaid, Trade expenses, Printing, Discount allowed, Interest on Capital, Depreciation on each asset, Bad debts + new Provision for Doubtful Debts) → Net Profit/Loss. 3. Balance Sheet: Liabilities side = Capital + Interest on Capital − Net Loss (or + Net Profit) − Drawings, Creditors (net of reserve for discount), Bills Payable, Outstanding expenses. Assets side = Fixed assets net of depreciation, Debtors net of provision for DD, Closing Stock, Prepaid Insurance, Cash/Bank. - Result in this problem: Gross Profit ₹6,600; Net Loss ₹390 (expenses like interest on capital and depreciation pushed it into a loss); Balance Sheet totals ₹33,110 both sides.
Golden rule for adjustments appearing in the trial balance vs. outside it: an item already inside the trial balance is posted only ONCE (P&L or Balance Sheet, whichever fits); an adjustment given separately (like closing stock, outstanding expenses, prepaid expenses, provisions) is always posted TWICE — once in Trading/P&L A/c and once in the Balance Sheet. This "double effect" rule is the single most common thing students get wrong in this question type.
(A second similar full worked problem, for Rajeev's final accounts on 31 Dec 2009 with Capital 35,000, Drawings 6,000, Bank Loan 4,200, and comparable adjustments, follows the identical method above and arrives at a Balance Sheet total of ₹59,450 both sides — useful as a second practice pass on the same technique.)
SLM vs WDV — Exam favourite comparison
| Basis | SLM | WDV |
|---|---|---|
| Depreciation base | Original cost (constant) | Book value (declining) |
| Annual charge | Same every year | Decreases every year |
| Asset value at end of life | ~Zero | Never fully zero |
| Suitability | Buildings, leasehold | Plant/machinery, tax purposes (India) |
Change in depreciation rate/useful life: applied prospectively only (not retrospective) — spread remaining depreciable value over the revised remaining useful life.
Module Summary (from Lesson 22, straight from the course's own recap screen)
- Financial analysis involves identifying the financial strengths and weaknesses of a business by establishing relationships between elements of the balance sheet and income statement — used to assess liquidity, solvency, profitability, and operational efficiency, and to evaluate short- and long-term prospects.
- The primary function of financial statements is to provide valuable information about the financial position and operating strength/weakness of the enterprise to interested parties — management, investors, creditors, banks, employees, government, customers, the public, trade associations, and stock exchanges.
- Income statements (P&L statements) provide information on the results of operations over a specific period (year, quarter, or month) by summarising and categorising revenues and expenses.
- When income is increased by the sale value of goods/services sold, it is also decreased by the cost of those goods/services — called Cost of Sales (or Cost of Goods Sold in manufacturing/retail); the complexity of calculating it varies with the nature of the business.
- Profit After Tax (PAT) is the net profit available to shareholders after paying all costs and taxes — applicable to any business unit, government-owned, privately-owned, or a limited liability company.
- Liabilities represent the financial obligations or debts a company owes to external parties, arising from borrowing money, purchasing goods/services on credit, or accruing unpaid expenses.
- Depreciation is the decrease in the value of assets over time as they are used in business operations; depreciable assets exclude land, goodwill, forests, livestock, or R&D costs.
- In the annuity method, depreciation is calculated based on both the value of the asset and the interest on it — assuming the depreciation plus the normal capital cost to finance the asset stays constant over its life.
- The sinking fund method calculates depreciation while also setting aside a fund to replace the asset at the end of its useful life.
Glossary (from Lesson 23)
🧠 Memory trick — "I Cut Profits, Working Deeply": Income Statement, COGS, PAT, Working Capital, Depreciation.
- Income Statement: A financial statement that shows the revenues, expenses, and net income of a business over a specific period, usually a year, quarter, or month.
- Cost of Goods Sold (COGS): The direct costs attributable to the production of goods or services sold by a company, including materials, labor, and overhead costs.
- Profit After Tax (PAT): The net profit available to shareholders after all costs and taxes have been paid by the business.
- Working Capital: The difference between current assets and current liabilities, representing the amount of capital available to a business for its day-to-day operations.
- Depreciation: The decrease in the value of assets over time, reflecting their use in the operation of a business.
Self-Study Exercise Prompts (from Lesson 25, "attempt in your notebook")
- What is the purpose of an income statement? Explain the components of an income statement.
- How is Profit After Tax (PAT) calculated, and why is it important?
- What are the components of a balance sheet? Focus on liabilities, assets, and working capital.
- How do equity changes impact a company's balance sheet?
- What is depreciation, and why is it important in accounting? Explain the straight-line method of depreciation.
Learning Activities (from Lesson 26, group/self-practice prompts)
- Divide participants into small groups and provide them with a case study or set of financial data. Each group prepares a complete set of financial statements (Income Statement, Balance Sheet, Cash Flow Statement), interprets them, and makes recommendations based on their findings.
- Assign participants to select a real company and gather its published financial statements. Prepare a comprehensive analysis of its financial performance — trends, ratios, and comparisons to industry benchmarks — then present findings and recommendations to the class.
Long-Answer Questions (15 Marks — model answers, ~300 words each)
Q1. What are the essential qualities of financial statements? Explain each with its significance. Financial statements are only useful if they possess certain qualitative characteristics that make the information they contain trustworthy and actionable for decision-makers. Understandability means the statements should be presented clearly enough that users with reasonable business/accounting knowledge can grasp their meaning without needing specialist interpretation — achieved through standard formats, clear headings, and explanatory notes. Relevance requires that the information influences the economic decisions of users by helping them evaluate past, present, or future events, or confirm/correct prior evaluations — irrelevant clutter defeats the purpose of reporting. Reliability and Accuracy demand that the figures be free from material error and bias, faithfully represent what they claim to represent, and be verifiable against source documents — this is why audited statements carry more weight than unaudited ones. Comparability means the statements should be prepared consistently period-over-period (same accounting policies) and, ideally, in formats similar to industry peers, so that trends over time and differences between companies can be meaningfully assessed — this is why the Consistency convention and standard formats (Schedule III under Companies Act) matter. Completeness requires that all material information needed for a true and fair view is disclosed, including contingent liabilities, related-party transactions, and accounting policy choices — omissions can mislead users just as much as errors. Finally, Timeliness means information must reach users while it is still capable of influencing their decisions — a brilliant balance sheet published two years late has lost most of its decision-usefulness, which is why regulators impose filing deadlines. Together these six qualities — understandability, relevance, reliability, comparability, completeness, and timeliness — form the benchmark against which the quality of any company's financial reporting is judged, and violations of any one of them (e.g., delayed reporting, inconsistent policies, hidden liabilities) are classic red flags for auditors, analysts, and regulators alike.
Q2. Explain the different users of financial statements and their specific information needs. Financial statements serve a wide range of stakeholders, each approaching the same numbers with a different question in mind. Management and Owners use them for internal decision-making — assessing operational efficiency, planning expansion, and evaluating whether the business is meeting its objectives. Investors (existing and prospective shareholders, and debenture holders) study profitability, growth, and risk to decide whether to buy, hold, or sell their stake, and to judge the safety of returns on their investment. Trade Creditors and Suppliers examine liquidity and payment history to judge whether the business will honour its short-term obligations before extending further credit. Banks and Lenders focus on solvency, gearing (debt-equity), and cash flow generation to assess repayment capacity before sanctioning or renewing loans — this is why interest coverage and debt-equity ratios matter so much to them. Employees and their representative unions look at profitability and stability to gauge job security, scope for wage negotiation, and the sustainability of retirement benefits. Government and regulatory bodies (Income Tax Department, SEBI, MCA, RBI) use financial statements to assess tax liability, ensure regulatory compliance, and formulate economic policy at a macro level based on aggregated corporate performance. Customers, particularly those in long-term contracts or dependent on a single supplier, monitor financial health to judge whether the business will remain a going concern and continue reliable supply. Finally, the general Public and researchers use published statements to understand a company's contribution to the economy, employment, and environment — especially relevant given rising ESG/CSR scrutiny. Because these groups have different priorities but read the same set of statements, accounting standards insist on neutrality — statements cannot be tailored to please one user group at another's expense.
Q3. Distinguish between an Income Statement and a Balance Sheet. The Income Statement (Trading and Profit & Loss Account) and the Balance Sheet are the two core financial statements, and while they are prepared from the same underlying ledger, they answer fundamentally different questions. The Income Statement is a flow statement — it measures performance over a period (e.g., the year ended 31 March), showing how much revenue was earned and how much expense was incurred to earn it, arriving at Net Profit or Loss (Revenue − Expenses). It follows a "waterfall" structure: Net Sales, less Cost of Goods Sold, gives Gross Profit; less Operating Expenses gives Operating Profit (EBIT); less Interest gives Profit Before Tax; less Tax gives Profit After Tax. The Balance Sheet, in contrast, is a stock/position statement — it captures the business's financial position at a single point in time (e.g., as at 31 March), listing what the business owns (Assets), what it owes to outsiders (Liabilities), and the owners' residual stake (Capital/Equity), governed by the equation Assets = Liabilities + Capital. Assets and liabilities are further classified as Current (realisable/payable within a year) or Non-current/Long-term. The two statements are linked: the Net Profit computed in the Income Statement flows into the Balance Sheet as an addition to Capital/Retained Earnings (after deducting any drawings or dividends), which is why an error in one statement typically distorts the other. In short — the Income Statement explains how the business performed during the period, while the Balance Sheet shows where it stands as a result, and both together, along with the Cash Flow Statement and notes, are needed for a complete picture of financial health.
Q4. Explain the Straight Line Method (SLM) and Written Down Value (WDV) methods of depreciation, with a numerical example. Depreciation is the systematic allocation of a tangible fixed asset's cost over its useful life, reflecting wear, tear, and obsolescence (governed by AS-6 / Ind AS 16). Two of the most common methods are SLM and WDV. Under the Straight Line Method, an equal amount of depreciation is charged every year, calculated as (Original Cost − Scrap/Residual Value) ÷ Useful Life in years. For example, a machine costing ₹1,00,000 with an estimated scrap value of ₹10,000 and a useful life of 9 years would be depreciated at (₹1,00,000 − ₹10,000) ÷ 9 = ₹10,000 per year — the same ₹10,000 charged to the P&L every year until the book value reaches the scrap value. Under the Written Down Value Method, depreciation is charged as a fixed percentage on the asset's book value at the start of each year (not on original cost), so the depreciation amount declines every year. For the same machine, if the WDV rate is 10%, Year 1 depreciation = 10% of ₹1,00,000 = ₹10,000 (book value now ₹90,000); Year 2 depreciation = 10% of ₹90,000 = ₹9,000 (book value now ₹81,000); and so on — the charge keeps shrinking but the asset's book value never reaches exactly zero. The key practical differences: SLM gives a constant, easily budgeted annual charge and is preferred for assets like buildings and leasehold property, whereas WDV gives a heavier charge in early years (matching the fact that plant and machinery is often most productive and loses value fastest when new), aligns with Indian Income Tax Act depreciation rules, and is widely used for plant, machinery, and vehicles. Any subsequent revision to the depreciation rate or remaining useful life is applied prospectively only — the remaining depreciable amount is simply spread over the revised remaining life, without restating past years' depreciation.
Q5. What is Working Capital? Explain its calculation and significance in financial management. Working Capital is the capital available for a business's day-to-day operations — it represents the funds tied up in short-term assets net of short-term obligations, and is calculated as Working Capital = Current Assets − Current Liabilities. Current Assets include cash and bank balances, marketable securities, accounts receivable (debtors), inventory (raw material, WIP, finished goods), and prepaid expenses — items expected to be converted into cash within one year. Current Liabilities include accounts payable (creditors), short-term loans, accrued expenses, outstanding taxes, and unearned/advance revenue — obligations due for settlement within one year. When Current Assets exceed Current Liabilities, the business has positive (net) working capital, indicating it can comfortably meet its short-term obligations as they fall due — a sign of short-term solvency and liquidity. Negative working capital, where current liabilities exceed current assets, signals potential difficulty in meeting near-term obligations and can be an early warning of cash-flow stress, even for an otherwise profitable business. Working capital matters because a business can be profitable on paper (per its Income Statement) yet still fail if it runs out of cash to pay wages, suppliers, or short-term loans — this is the classic "profit vs cash" distinction that trips up many growing businesses, especially those extending generous credit to customers while paying suppliers quickly. Effective Working Capital Management involves optimising the levels of inventory (not too much, tying up cash; not too little, risking stock-outs), managing receivables (collecting from debtors promptly via the Debtors Turnover/Collection Period ratio), and managing payables (taking full credit terms from suppliers without damaging relationships), all monitored through ratios like the Current Ratio (ideal ≈ 2:1) and Quick/Acid-Test Ratio (ideal ≈ 1:1). A Cash Budget is often prepared alongside working capital analysis to forecast short-term cash surpluses or shortfalls and plan financing accordingly.